How to deal with outliers?
The Data Q Assistant identifies four different types of outliers:
-
Extreme (positive or negative) values
-
Explicit consideration of zeros (can be activated in the settings menu)
-
Values with an unusual sign (positive or negative) (can be activated in the settings menu)
-
Values with an unusual growth rate (from one cell to another) (can be activated in the settings menu)
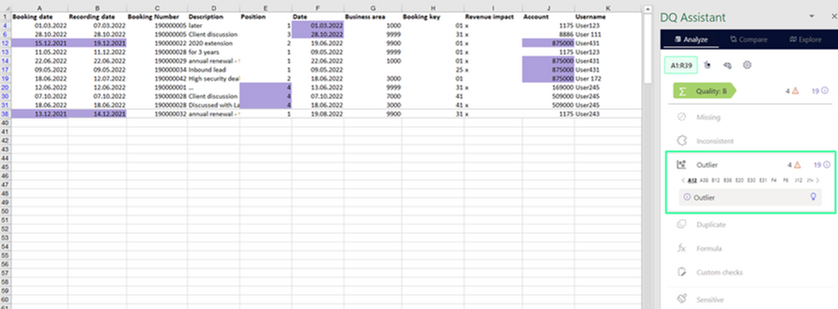
The sensitivity of extreme values (based on the interquartile range) can be adjusted in the settings menu. Here, also the specific outlier checks can be toggled on/off:

Dealing with outliers defined as extreme values:
-
Always check the value in the context of the other information given in the respective row/column (e.g., for time series check the previous and subsequent values, for a selling price the number cannot be negative, ...)
-
For all numbers that seem to be incorrect, contact the respective expert colleague or include the right number yourself
Dealing with outliers defined as values with an unusual sign:
-
Always check the value in the context of the other information given in the respective row/column (e.g., for time series check the previous and subsequent values, for a selling price the number cannot be negative, ...)
-
Check if the number 'per se' is correct, but there is just a wrong sign by accident
-
If the number seems to be incorrect independent of the sign, contact the respective expert colleague or include the right number yourself
Adjusted numbers will always be highlighted in bright green, so it is easy to trace back all changes.